The velocity ceiling: why an Indian melt-up won’t look like Taiwan’s

The Nifty cannot melt up the way Taiwan's market just did, and the reason is the same thing that keeps it from blowing up.

The Nifty cannot melt up the way Taiwan's market just did, and the reason is the same thing that keeps it from blowing up.

Why retail investors fixate on fees and taxes, and miss what actually moves their returns

One of the most common questions investors ask is, “what percentage of your trades are winners?” It sounds perfectly reasonable. And honestly, it’s the same question I would have asked a few years ago. We’re wired to think in terms…
Modern Portfolio Theory taught a generation of investors that risk equals volatility. That conflation is fine for a 60-year-old living off their portfolio. For a 30-year-old with three decades of compounding ahead, it is one of the most expensive ideas in personal finance.

Money is not a spreadsheet problem. The conversation keeps pretending it is.
Most equity investors think they own "the market." They actually own a factor. Over 21 years on Nifty 500 data, the gap between the best and worst factor turned ₹1 lakh into either ₹52 lakhs or ₹13 lakhs. The interesting part is not which factor won. It is what each factor put its investor through to get there.
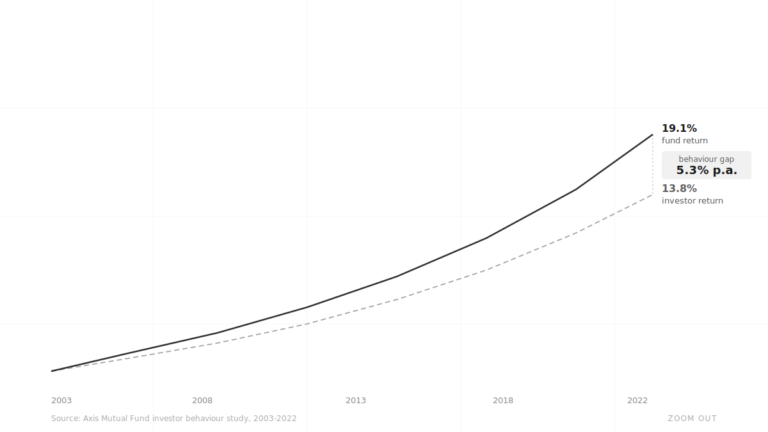
Equity funds delivered 19% CAGR over 20 years. The average investor in those same funds earned 14%. That 5 percentage point gap is not a fees problem. It is not a fund selection problem. It is a behaviour problem — and the data makes it impossible to ignore.
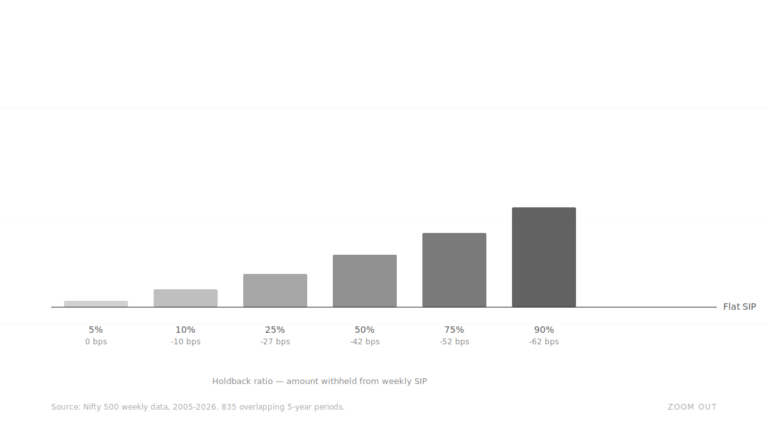
We tested 835 overlapping 5-year periods on Nifty 500 data. At every holdback ratio, the Buy the Dip SIP loses to a flat SIP. The more you hold back, the more you lose. The dumb SIP wins because it never hesitates.
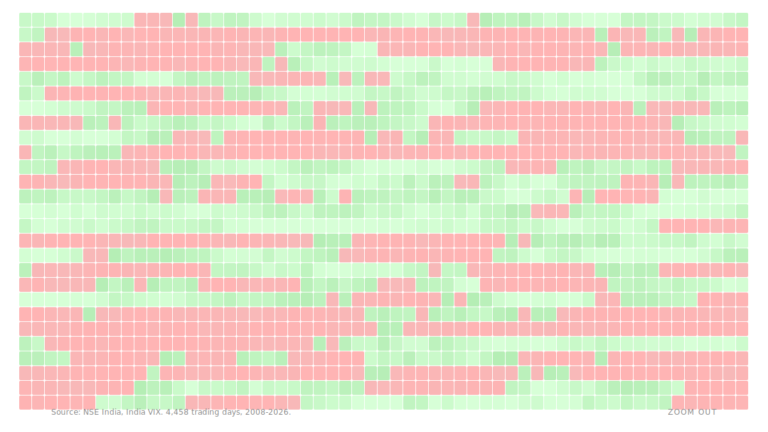
We mapped every trading day since 2008 across Nifty 50 and India VIX. Volatility doesn't arrive randomly — it travels in waves. Here's what 4,458 trading days look like laid out in a grid.