In 1992, Eugene Fama and Kenneth French published a paper showing that simple, observable characteristics of a company — how cheap it was on price-to-book, how profitable it had been — explained a large chunk of stock returns that the standard market beta could not. That paper started the field of factor investing.
Three decades later, the expanded list of factors have names that most retail investors will recognise. Quality. Value. Momentum. Low Volatility.
In India, NSE has been publishing rules-based indices for these four factors since 2005. Each index picks 50 stocks from the Nifty 500 universe based on a single, documented selection rule, with no manager discretion involved. They are the cleanest data available for asking how each factor has actually performed in Indian equities.
I pulled 21 years of weekly data on all four indices, the Nifty 500 itself, and India VIX where available. The findings are sharp.
What each factor actually selects
Before the data, the rules. The four NSE factor indices are not opinions or fund manager picks. Each one is a published, mechanical formula that selects 50 stocks from the Nifty 500 universe and rebalances them on a fixed schedule.
Momentum 50 picks the 50 stocks with the strongest price momentum, that is, stocks which are already rising. It is a pure trend-following bet.
Low Volatility 50 picks the 50 stocks in the Nifty 500 with the lowest standard deviation of daily returns over the past 12 months, meaning they do not move much in either direction.
Quality 50 picks the 50 stocks scoring highest on a composite of return on equity, earnings growth stability, and low debt to equity. It is a bet on financially robust companies.
Value 50 picks the 50 stocks scoring highest on a composite of low P/E, low P/B, and high dividend yield. It is a bet on inexpensiveness of a stock.
These four indices are exposed to the same Nifty 500 universe, the same regulatory environment, the same currency, and the same macro shocks. The only thing that differs is the selection rule.
What ₹1 lakh became
Invest ₹1 lakh in each factor index on 1 April 2005. Hold until 24 April 2026. Reinvest nothing. Withdraw nothing.
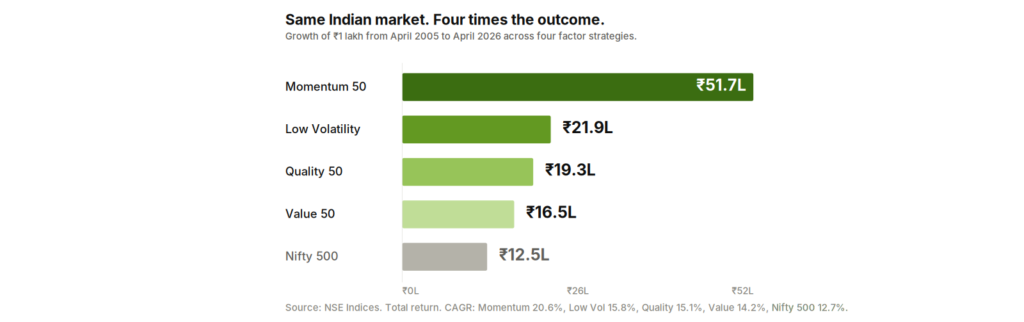
Momentum 50 turned ₹1 lakh into ₹51.7 lakhs. The Nifty 500 turned the same ₹1 lakh into ₹12.5 lakhs. Same market, same starting capital, a four-times difference in outcome.
Low Volatility came second at ₹21.9 lakhs. Quality at ₹19.3 lakhs. Value at ₹16.5 lakhs. Every single factor index beat the broad-market benchmark, and four of them did so by a wide margin. The CAGR figures: Momentum 20.6%, Low Volatility 15.8%, Quality 15.1%, Value 14.2%, Nifty 500 12.7%.
If the answer ended here, it would be obvious. Buy Momentum, hold for 21 years, become wealthy. The honest reading of the data is more uncomfortable.
What each factor cost the investor
A 21-year return number assumes the investor held the factor without flinching. Almost nobody does that. The more useful measure is what the factor put its investor through during the holding period.
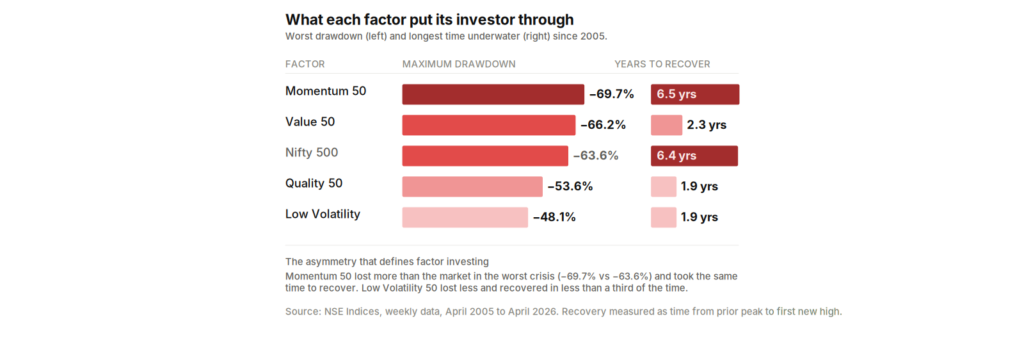
Momentum lost 69.7% from peak to trough during the global financial crisis. The index then took 6.5 years to make a new high. For 78% of the weeks in this 21-year sample, a Momentum investor was holding a portfolio worth less than its previous peak.
Value 50 was nearly as bad. Maximum drawdown of 66.2%. Time below previous high: 84% of all weeks. For four-fifths of the 21-year sample, the Value investor was sitting on a loss.
The Nifty 500 itself bottomed at minus 63.6% and took 6.4 years to recover. So the broad market and Momentum had almost the same drawdown experience, but Momentum delivered four times the terminal wealth.
Then there is Low Volatility. Maximum drawdown: 48.1%. Time to recover: 1.9 years. Time below previous high: 67% of weeks. The smallest hole, dug for the shortest time, with the second-highest 21-year return.
The risk-adjusted picture sharpens this. Annual return divided by annual volatility comes out as 1.00 for Low Volatility, 0.90 for Momentum, 0.84 for Quality, 0.64 for Nifty 500, and 0.52 for Value. Per unit of volatility taken, Low Volatility delivered more return than any other factor in the universe, including the one that produced four times the terminal wealth.
This is the first uncomfortable finding. The factor with the highest absolute return is not the factor with the highest return per unit of pain. The investor who optimises for the headline number ends up holding a strategy that was underwater for fifteen of the last twenty-one years and asked them to absorb a 70% loss in the middle of it.
Why each factor wins, and when
Lifetime averages hide a more useful pattern. Each factor wins in a specific market regime, and the regime is observable in real time. India VIX, which has been published since March 2008, is a clean enough proxy.
Sort all 946 weeks of VIX data into three equal-sized buckets by ranking on VIX. The bottom third becomes Calm (VIX up to about 15). The middle third becomes Normal (VIX 15 to 20). The top third becomes Stressed (VIX 20 and above). Then compute each factor’s average weekly return inside each bucket and annualise it.
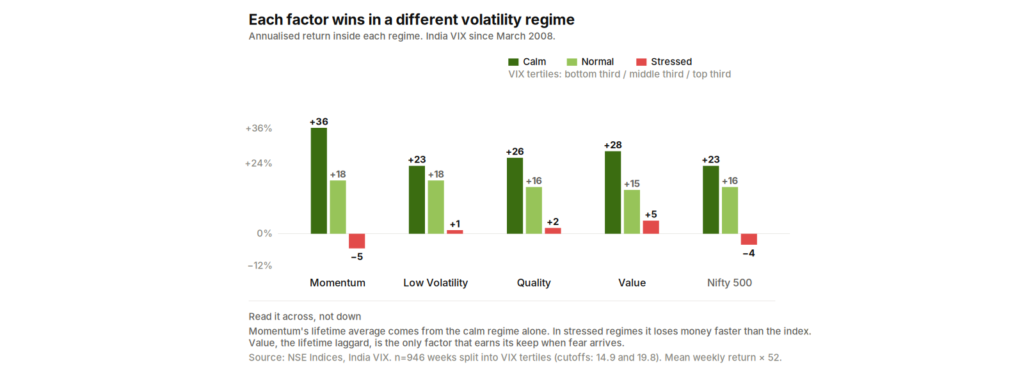
In calm regimes, Momentum is in a different category. 36% annualised. Every other factor returned between 23% and 28%. The market was cheap, fear was absent, and the trend was up. Momentum stocks ran.
In normal regimes, the gap closes. Momentum still wins at 18.5% but only slightly ahead of Low Volatility at 17.6%. Quality, Value, and the Nifty 500 cluster around 15-16%.
In stressed regimes, the picture inverts. Momentum loses 5.1% annualised. The Nifty 500 loses 4.2%. Low Volatility, Quality, and Value are all positive. Value is the best of the lot at 4.8%, the same factor that finished last over the full 21 years and spent four-fifths of the period underwater.
Read the chart across, not down. Momentum’s entire lifetime outperformance is concentrated in the calm regime. It does not outperform in the other two. It actively destroys capital in the stressed regime, faster than the index does.
This is not a curve fit. It is a description of what each factor is structurally exposed to. Momentum picks the stocks that have been going up. When the trend is up, those stocks keep going up. When VIX spikes, the trend breaks and Momentum stocks fall hardest because the cohort, by construction, was crowded into recent winners. Low Volatility picks the stocks that move the least. When the market panics, low-beta stocks fall less. The factor delivers the protection that its construction predicts.
Crisis by crisis
The regime view aggregates 946 weeks into three buckets. The crisis view breaks the same data into specific events. Seven distinct stress windows in Indian equities since 2008.
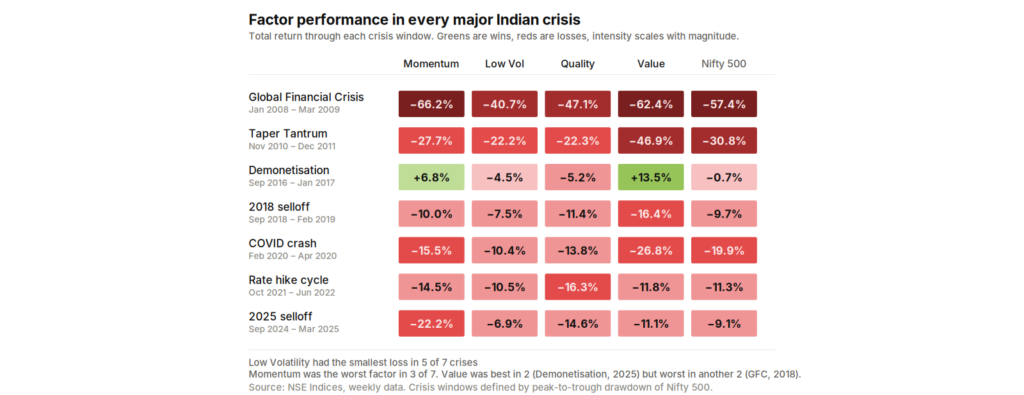
The pattern is consistent. Low Volatility was the best factor in five out of seven crises, including the global financial crisis (lost 40.7% versus Momentum’s 66.2%), the taper tantrum, the 2018 selloff, the COVID crash, and the 2025 selloff. Quality was the only factor that came close to matching it on consistency.
Momentum was the worst-performing factor in three of the seven, including the GFC and the 2025 drawdown where it fell 22.2% while the index lost only 9.1%. Value lost more than the market in three of seven, including the demonetisation period where it actually rose 13.5%, an exception explained by the fact that Value-tilted stocks tend to be cheap because they are unloved, and unloved stocks were less crowded going into the announcement.
The 2025 selloff is the most recent and the most instructive. Momentum lost 22.2% from peak to trough while Low Volatility lost only 6.9%. The factor that had been winning for the previous two years, the factor that retail flows were chasing through ETFs and mutual fund schemes, was the factor that gave back the most when conditions changed. This is not historical. It is the most recent regime shift, visible to anyone watching the market.
Across all seven crises, the picture is unambiguous. Momentum is the highest-returning factor and the most fragile. Low Volatility is the most defensive factor in every meaningful sense the data offers. Quality is consistent without being exceptional. Value is the most volatile of the four and the least predictable in stress.
The longer-window question
Roll a 5-year window through the entire history. Each week, ask: which factor produced the highest return over the next 260 weeks?
Momentum was the best factor in 65.8% of all 5-year windows. Value was best in 18.6%. Quality in 12.0%. Low Volatility in just 3.6%.
Now the inverse. Across all 5-year windows, what percentage of the time did each factor beat the Nifty 500?
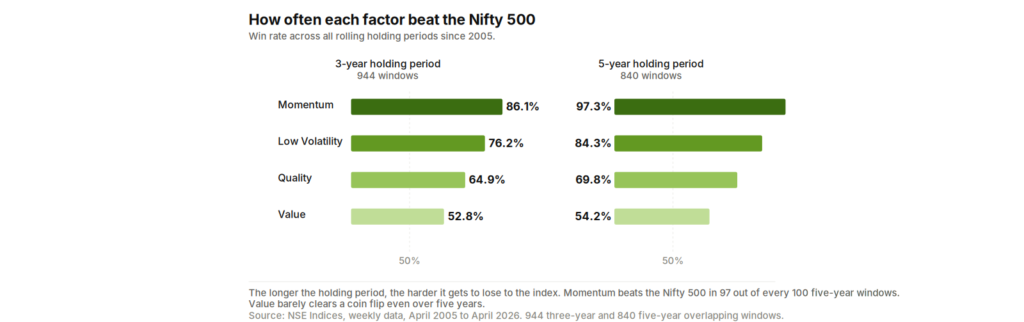
Momentum: 97.3% of windows. Low Volatility: 84.3%. Quality: 69.8%. Value: 54.2%.
Two findings here. First, Momentum is robust across long horizons. It beats the index more than nineteen times out of twenty over any 5-year holding period. Second, Low Volatility is rarely the single best factor in a window, but it almost always beats the index. It is the factor that wins quietly. Quality and Value win in a much narrower set of conditions.
For a 3-year holding window, the picture is similar but noisier. Momentum still wins 86.1% of the time against the index. Value drops to barely better than a coin flip at 52.8%.
The honest synthesis
There is no single factor that wins in every regime. There is also no single factor that an unaided investor will comfortably hold across all regimes. Momentum is the highest-returning factor over long periods, but it asks its holder to absorb 70% drawdowns and six-and-a-half-year recoveries. The retail investor who chased Momentum into 2007 and sold in early 2009 captured the loss without the recovery.
Low Volatility is the most psychologically sustainable strategy. It loses less, recovers faster, and produces the highest return per unit of volatility. But its 21-year return is less than half of Momentum’s. The investor who held Low Volatility instead of Momentum gave up roughly ₹30 lakhs of terminal wealth in exchange for a more comfortable journey.
Value is the regime-shift factor. It wins when the market is afraid, loses ground when the market is calm, and over the full sample produces the worst risk-adjusted return of the four. Quality is the in-between factor. It does nothing exceptionally well and nothing exceptionally badly.
The investor who treats all four factors as equivalent, with equal allocations and equal expectations, is making a categorical error. They are different bets on different states of the world. Holding all four in equal proportion is not diversification. It is the assumption that you have no view on which regime you are in.
The data suggests that view is available, in real time, at the cost of pulling up an India VIX chart on a Tuesday.
Data: NSE Indices, India VIX. Weekly closing values, 1 April 2005 to 24 April 2026. 1,100 trading weeks. India VIX series begins 14 March 2008. No taxes or transaction costs assumed. Drawdown is measured peak-to-trough on weekly closes. Regime returns are computed as the mean weekly return inside each bucket, annualised by multiplying by 52. Bucket boundaries are exact tertiles of the VIX distribution.