When the market falls, the thinking is straightforward. Stocks that have run up the most have the most to give back. So if you ranked the market by recent gains and watched a correction unfold, the top of the list should fall hardest. The high-flyers crack first.
The latest fall in Indian equities tells you that’s wrong.
What actually happened
Between January and April this year, the Nifty 50 fell 13.7% from peak to trough. We took the top 800 NSE-listed stocks at the start of the fall, ranked them by their previous 6-month return, and split them into ten equally sized deciles. D1 holds the highest-momentum names. D10 holds the lowest. Then we held each decile through the fall and looked at the median return in each.
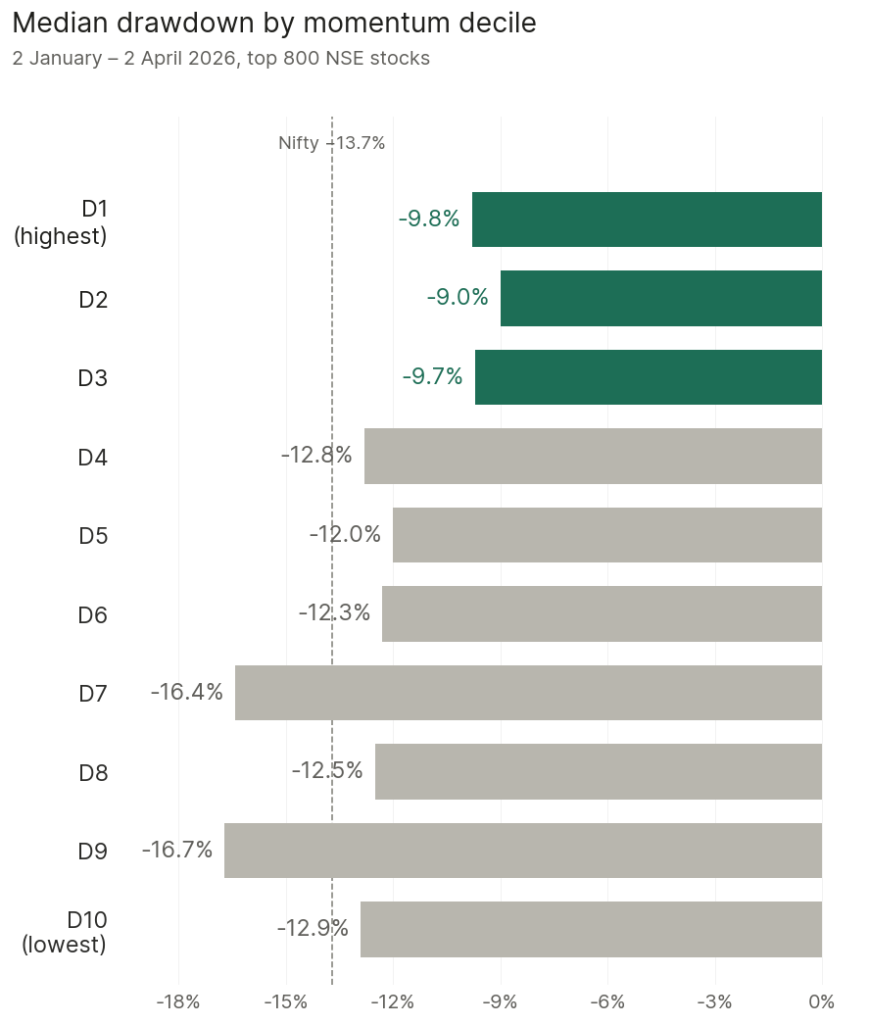
The median return in D1, the supposed high-flyer bucket, was −9.8%. In D2, −9%. In D3, −9.7%. The top three deciles, the 240 highest-momentum names, had median drawdowns two to seven percentage points shallower than every other decile and almost four points shallower than the Nifty.
The names that had run up the most actually fell the least.
Where the falls actually happened
The deepest drawdowns weren’t at either end of the spectrum. They were in D7 and D9, with median returns of −16.4% and −16.7%. D10, the previous losers, had a median return of −12.9%, roughly with the index. The middle deciles, D4 through D6, also fell between 12% and 13%.
The shape isn’t “high-flyers crack first.” It’s closer to “high-flyers hold up, the back end of the pack takes the worst beating, and everyone else falls about as much as the market.”
The most extreme cases
If high-flyers crack first, the most stretched of them should crack hardest. The ten stocks with the highest 6-month returns at the peak had run up between 70% and 350% over the prior six months. Held through the fall, their median return was essentially zero. Half of them went up during the correction itself.
The names you’d pick out as most vulnerable were among the most resilient.
Is this just one fall?
It is one fall, cleanly measured. We checked the same construction informally against earlier Nifty corrections over the last 10 years. Across 8 corrections, D1 was the worst-falling decile exactly once. In every other fall, the deepest-dropping decile was somewhere else on the spectrum. Most often, it was D10, the previous losers, who fell harder than the previous winners by margins as large as 20 percentage points.
One clarification. This piece is about how high-momentum names behave during a market correction. Long-run studies of momentum factor indices in India, including some we’ve published, document that momentum strategies have suffered deep drawdowns of their own, 66% in 2008, with recoveries that took years. Both findings hold. In an ordinary correction, the high-flyers don’t tend to be the worst names. In a generational regime shift, momentum strategies as a whole can still get crushed. Different questions on different time horizons.
Why this matters
The top momentum decile is built from stocks that have run up the most. The instinct says treat it like the most fragile bucket in a correction. In this correction it was the most resilient. Across the last decade, it has almost never been the most fragile.
The high-flyer mental image is wrong about which end of the distribution falls hardest in a correction.
Construction footnote: The 800 stocks in the universe (the current top 800 NSE-listed by market cap) are ranked at the start of the fall by their compounded return over the prior 26 weeks and split into ten equally sized deciles. The chart shows the median peak-to-trough return of stocks in each decile, held passively through the fall.