Skip to content
  • About
  • Articles
  • Home
  • Tools
Zoom Out
  • Home
  • Articles
  • About
Subscribe
Zoom Out
  • Data Viz, Long read

“Buy More When Markets Fall” – Does It Actually Work?

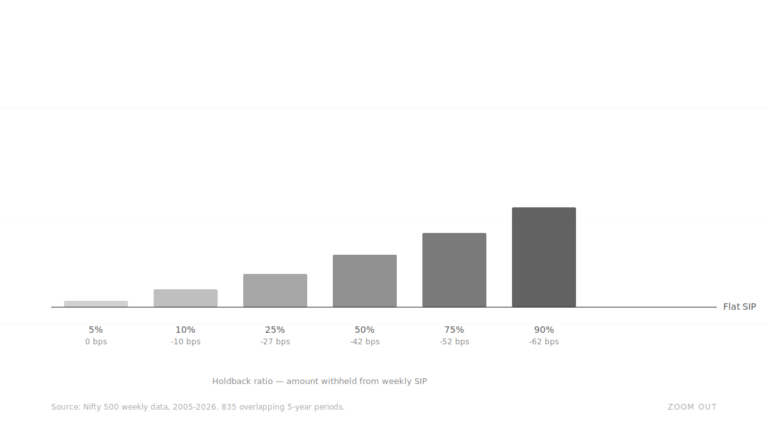
We tested 835 overlapping 5-year periods on Nifty 500 data. At every holdback ratio, the Buy the Dip SIP loses to a flat SIP. The more you hold back, the more you lose. The dumb SIP wins because it never hesitates.

  • Pratik
  • March 24, 2026
  • 1 Comment
  • Data Viz, Long read

Volatility Clusters – 18 Years of NSE Data Proves It

We mapped every trading day since 2008 across Nifty 50 and India VIX. Volatility doesn't arrive randomly — it travels in waves. Here's what 4,458 trading days look like laid out in a grid.

  • Pratik
  • March 14, 2026
  • Short Take

Why Ratio Charts Don’t Work: The Seductive Trap of Mean Reversion

Ratio charts have become a staple tool for traders seeking to time markets. The logic seems elegant: when gold becomes “expensive” relative to silver, or when stocks become “undervalued” compared to gold, the ratio must eventually revert to its mean.…

  • Pratik
  • January 15, 2026
Prev
1 2

Zoom Out · For informational purposes only. Not investment advice.