Volatility Clusters – 18 Years of NSE Data Proves It
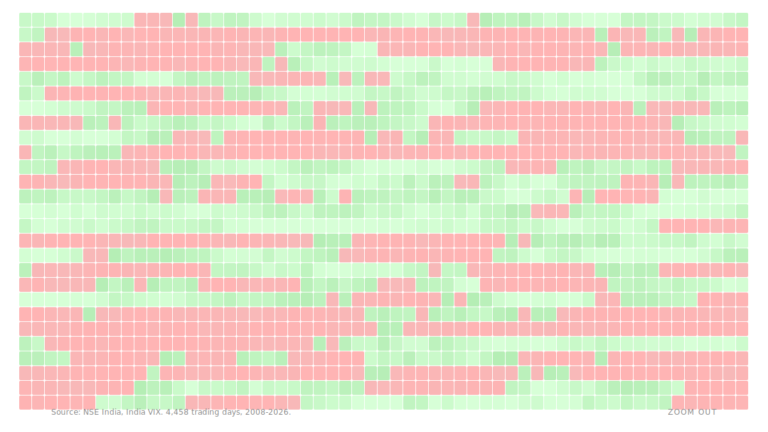
We mapped every trading day since 2008 across Nifty 50 and India VIX. Volatility doesn't arrive randomly — it travels in waves. Here's what 4,458 trading days look like laid out in a grid.


We mapped every trading day since 2008 across Nifty 50 and India VIX. Volatility doesn't arrive randomly — it travels in waves. Here's what 4,458 trading days look like laid out in a grid.
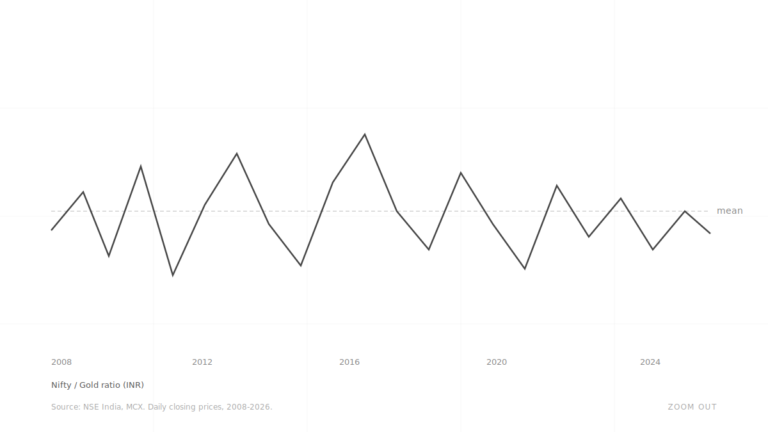
Ratio charts have become a staple tool for traders seeking to time markets. The logic seems elegant: when gold becomes “expensive” relative to silver, or when stocks become “undervalued” compared to gold, the ratio must eventually revert to its mean.…