The dumb SIP wins. Not sometimes. Not in most market conditions. Every single time, across every possible 5-year period we tested on Nifty 500 data going back to 2005.
This is uncomfortable because the logic behind buying the dip is sound. Lower prices mean better entry points. More units at lower NAV. Compounding working harder. The math is correct in isolation.
The problem is the math doesn’t account for what happens while you wait for the dip.
We ran the numbers. 835 overlapping 5-year periods, 1,094 weekly data points, every possible holdback ratio. The results are unambiguous — and they challenge one of the most repeated pieces of investing advice in India.
The Setup
Flat SIP Rs 10,000 into equity every week. No conditions. No signals. Just deploy.
Buy the Dip SIP Normal weeks: invest a portion of Rs 10,000 into equity, park the rest in a liquid fund earning 5.5%. Dip weeks (market more than 15% below its 52-week high): invest Rs 20,000 into equity by pulling Rs 10,000 from the liquid buffer.
Same Rs 10,000/week commitment. The only question is how much to hold back during normal weeks to fund the “double down” during crashes.
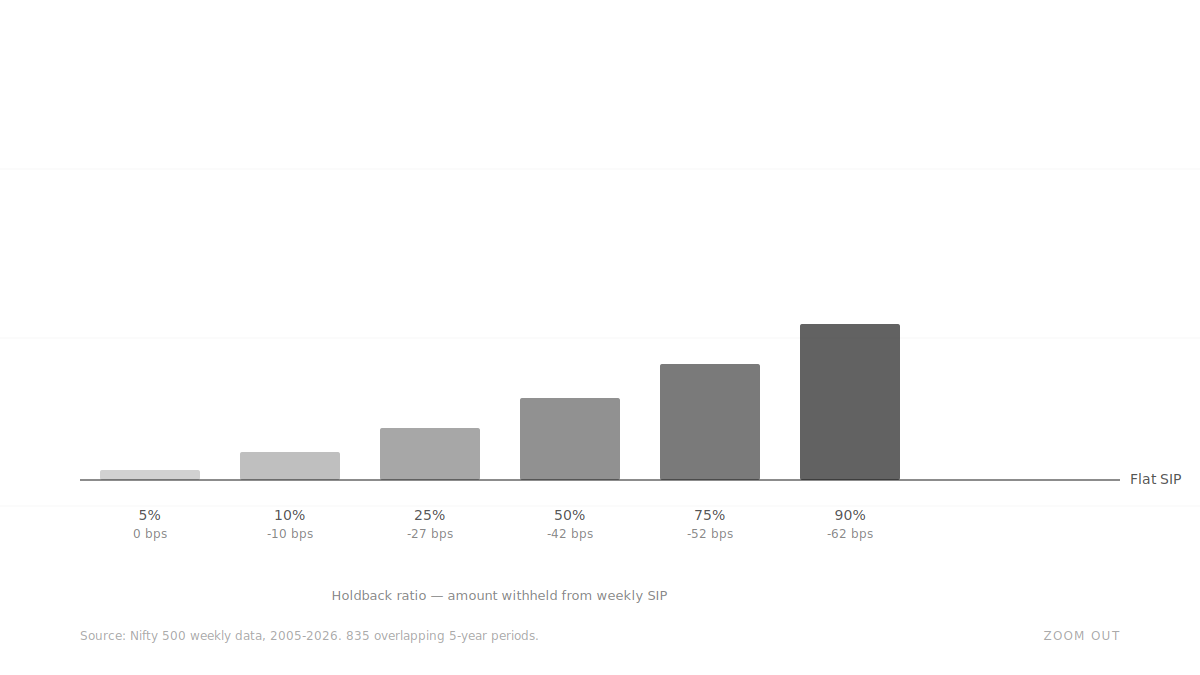
The interactive tool below lets you choose the holdback ratio and see the result across all 835 periods.
The Results
The Takeaway
At every holdback ratio, the Buy the Dip strategy either breaks even or loses to the flat SIP.
Hold back 5% and you get 0 bps edge. Hold back 10% and you lose 10 bps. Hold back 25% and you lose 62 bps — Rs 59,000 on Rs 26 lakh invested. The more you hold back, the worse it gets.
Why Doesn’t This Work?
1. The opportunity cost is permanent. Money parked in the liquid fund earns 5.5%. Equity averages 12%. Every week you hold back, you pay the difference. Over 260 weeks, that drag compounds.
2. Dips are rare. Your buffer keeps growing. The market was more than 15% below its 52-week high for roughly 10-15% of all weeks in the dataset. The remaining 85-90% of the time, your liquid buffer is just accumulating and earning 5.5% instead of 12%.
3. When dips do come, they cluster. During the COVID crash, the market was below -15% for 16 weeks straight. The liquid buffer had roughly Rs 48,000 built up (at 90/10). It funded Rs 20,000 deployment for a few weeks, then ran dry. For the remaining dip weeks, the strategy had no extra firepower. It was just a flat SIP anyway.
4. The 2021-2024 “winning streak” is an illusion. If you look at the bar chart, Buy the Dip appears to outperform for periods ending 2021-2024. That is because every one of those 5-year periods contains the COVID crash. The funded weeks happened to land at the exact bottom. Once the crash rolls out of the window, the edge disappears. It is not the strategy working — it is one lucky dip inside the window.
But Here Is What Most People Actually Do
Market drops 15%. You panic. You stop your SIP. Money sits in liquid fund. You wait and watch. You resume only when the price crosses back above the level where you stopped.
We tested this “Panic SIP” across the same 835 periods. Same Rs 10K/week commitment.
It lost to flat SIP in 97.8% of all 5-year periods. Average annualized return dropped by 138 bps. The investor was out of the market for 15.8% of all weeks.
And here is the uncomfortable finding: at a 50/50 holdback, the Buy the Dip strategy (-153 bps) performs worse than the Panic SIP (-138 bps). The investor who carefully planned their dip-buying underperforms the investor who just panicked and stopped. Planning to be clever is more expensive than losing your nerve.
Conclusion
The only holdback ratio that does not hurt you is one so small (5%) that it is barely a strategy at all.
Every other ratio costs you money. The more you hold back, the more you lose. At the ratios people actually use (75-90%), the cost ranges from Rs 10,000 to Rs 59,000 on Rs 26 lakh invested over 5 years.
The dumb SIP wins because it never hesitates. There is a version of this finding that should make every investor uncomfortable. The investor who carefully planned their dip-buying — who held back capital, built a buffer, waited for the signal — underperformed the investor who simply panicked and stopped their SIP. Planning to be clever was more expensive than losing your nerve.
The market does not reward preparation for events that may or may not arrive on a useful schedule. It rewards time in the market. The flat SIP understood this instinctively. The dip-buyer spent five years waiting for a moment that either never came, came too briefly, or came so violently that the buffer ran dry within weeks.
The signal is clear. The base case is flat.
Data: Nifty 500 weekly closing prices, April 2005 to March 2026 (source: NSE India). All strategies commit Rs 10,000/week. Dip defined as market more than 15% below its 52-week high. Surplus money in liquid fund at 5.5% p.a. “Every possible period” means starting a new test from each week in the dataset, resulting in 835 overlapping 5-year periods.