Most investors treat volatility like a weather event – unpredictable, randomly distributed, impossible to anticipate. You either get caught in the storm or you don’t.
We decided to look at the actual data rather than the assumption.
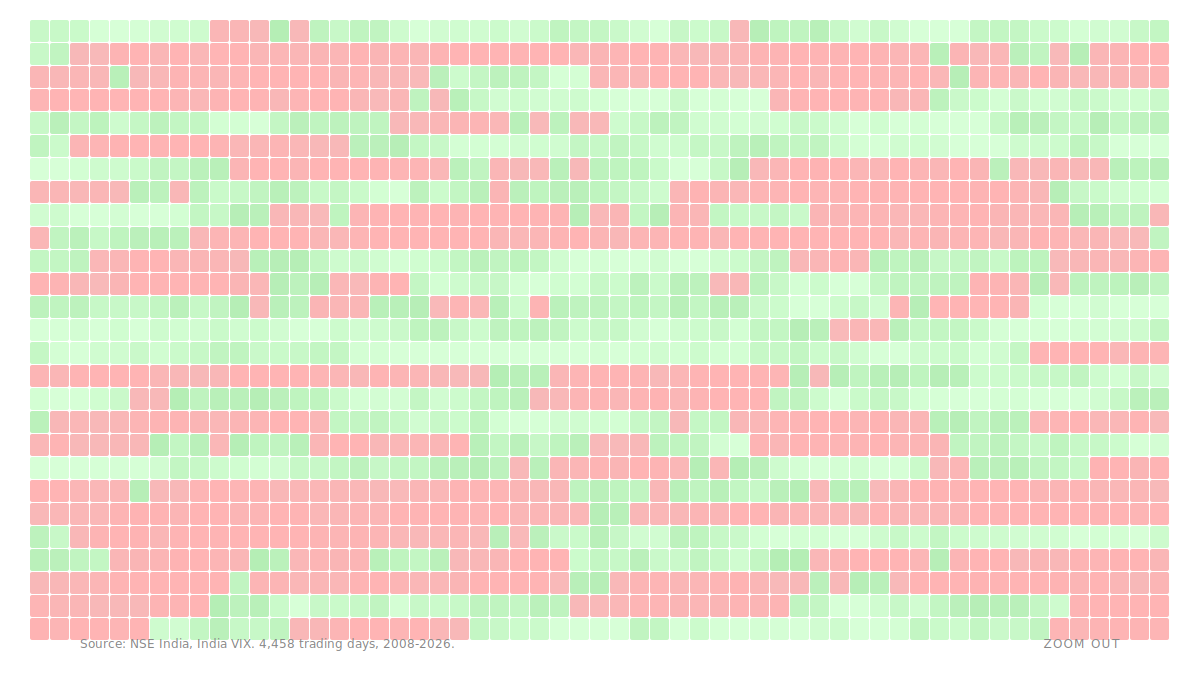
What follows is 18 years of Indian market volatility: 4,458 trading days from March 2008 to March 2026, mapped day by day. Every calm session. Every fear spike. Every crisis and recovery. Laid out in a single grid.
Before reading further, look at the chart. The pattern is not subtle.
Each cell is one trading day. The colour represents the India VIX reading that day, which is the NSE’s fear gauge, measuring expected volatility in the market. Pale cells are calm days. Deep red cells are days of high fear.
If volatility were random, you’d expect the red to be scattered – a speckle pattern distributed evenly across the calendar.
That is not what you see.
Fear Travels in Waves
The red arrives in dense blobs and then disappears for months, sometimes years. The calm periods are equally persistent: long stretches of pale colour where almost nothing happened.
This is not a visual trick or a consequence of how we’ve scaled the chart. It is one of the most robust and well-documented phenomena in financial markets, with a name: volatility clustering.
The observation dates back to Benoit Mandelbrot in 1963: large changes tend to be followed by large changes, and small changes by small changes. It was later formalised into the GARCH family of models by Robert Engle, for which he won the Nobel Prize in Economics in 2003. The phenomenon holds across virtually every liquid market ever studied.
The Indian market is no exception.
Reading the Chart: The Major Clusters
2008–2009: The Global Financial Crisis: India VIX peaked at 85.13 on November 17, 2008 — a level that has never been approached since. The cluster lasted the better part of 14 months, with only brief windows of calm. The 2009 general election result (May 18, 2009) produced the single largest one-day Nifty move in our dataset: +17.7%. Even that came within a period of elevated volatility.
2015–2016: The China Selloff and Demonetisation: Two distinct but partially overlapping clusters. The August 2015 China currency devaluation sent shockwaves through emerging markets. Just as things settled, the surprise demonetisation announcement of November 2016 reignited volatility. Notice on the chart how these show up as two closely spaced red patches — a pattern that superficially looks like one long event but is actually two separate shocks with a brief calm window between them.
March 2020: COVID: The fastest and most violent cluster in the dataset outside of 2008. India VIX went from under 15 to over 70 in a matter of weeks. What is equally striking on the chart is how quickly the calm returned — by late 2020 the palette had reverted to pale green, even as the pandemic itself continued. Markets had repriced and moved on.
2022: The Rate Hike Cycle: Less dramatic in peak VIX terms than the previous crises, but notable for its duration. The combination of global rate hikes, the Russia-Ukraine war, and FII outflows produced a sustained period of elevated volatility lasting most of the year. This is a good example of a slow burn cluster — not a spike but a prolonged regime of moderate fear.
What This Means for How You Invest
The practical implication is one most investors never fully reckon with.
When you buy a drawdown on day three of a VIX spike, you are making a fundamentally different bet than buying on day sixty. Early in a cluster, the data suggests you are more likely to be buying into continued turbulence than into a turning point. Mean reversion is real — but it operates on a longer clock than most people’s patience allows.
The inverse is equally true. When VIX has been below 15 for months and the heatmap is uniformly pale, that is precisely when complacency is most expensive. The chart shows every calm period has ended. None of them were permanent.
This is not a call to time the market. It is a call to be honest about what regime you are operating in. The data justifies treating high-volatility and low-volatility environments as structurally different — not just emotionally different.
Zoom out far enough and the pattern becomes impossible to ignore.
Explore the Data Yourself
The chart above is fully interactive. Hover over any cell to see the exact India VIX reading, Nifty closing price, and daily return for that day. Toggle between VIX-based colouring and absolute daily return to see the same clustering effect from two different angles.
Data: Investing.com. Nifty 50 and India VIX daily closing values, March 2008 to March 2026, 4,458 trading days.