There is a number that should bother every mutual fund investor in India.
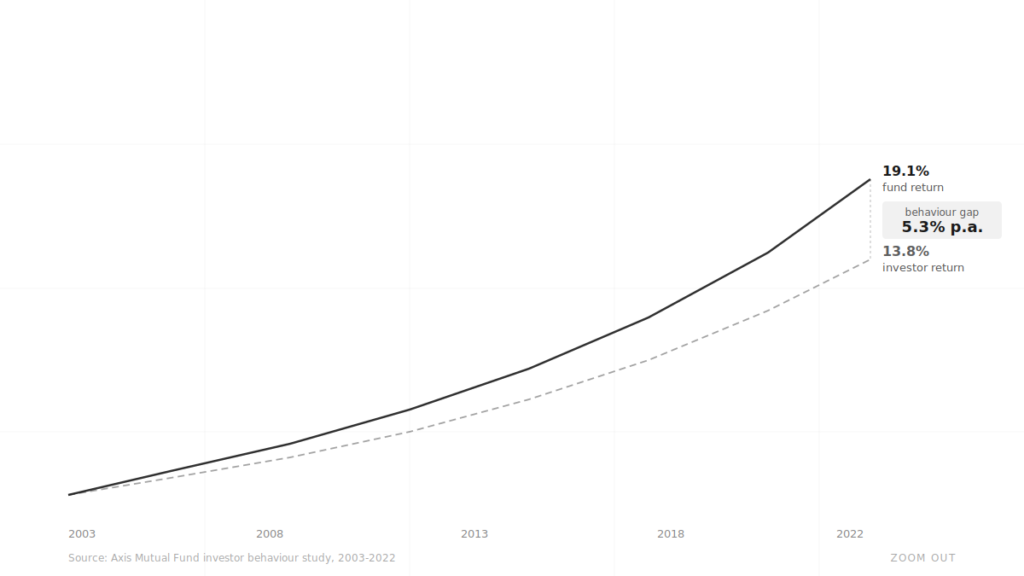
According to a 20-year study by Axis Mutual Fund covering 2003 to 2022, regular equity funds delivered 19.1% CAGR over the period. The average investor in those same funds earned 13.8%. That 5.3 percentage point annual gap is not a rounding error. Over 20 years, it is the difference between turning ₹10 lakh into ₹3.2 crore versus ₹1.3 crore. Nearly ₹2 crore left on the table — not by picking the wrong funds, but by behaving badly inside the right ones.
The Nifty 500 TRI, India’s broadest equity benchmark, has compounded at approximately 15% CAGR over the last decade. The investor who simply bought and held an index fund tracking it would have earned close to that. Most did not. The gap between what the market delivered and what investors actually earned is one of the most consistently documented phenomena in Indian finance — and one of the least discussed.
What the redemption data shows
AMFI publishes monthly SIP inflow and redemption data. When you overlay this against Nifty levels, a pattern emerges with uncomfortable clarity.
Redemptions spike precisely when markets fall. SIP registrations peak near all-time highs. The average retail investor is systematically buying expensive and selling cheap — not because they are irrational, but because they are responding logically to emotional signals that the market sends at exactly the wrong moments.
The 2020 COVID crash is the clearest example in recent memory. The Nifty 50 peaked near 12,431 in January 2020. By March 23, 2020, it had fallen to 7,610 — a drop of 38% in 46 trading days, one of the fastest crashes in Indian market history. SIP redemptions in March and April 2020 hit multi-year highs. Investors who stopped their SIPs or redeemed during that window locked in losses at the exact moment the market was pricing in maximum fear.
By November 2020 — just eight months after the bottom — the Nifty had fully recovered its pre-COVID peak. The investors who stayed in had recovered their losses and were compounding gains. The investors who redeemed in March were sitting on crystallised losses and facing a new decision: when to get back in. Most got back in late. That is what the data consistently shows across every crash cycle.
Three forces driving the gap
The behavioural finance literature identifies three compounding forces behind this pattern.
Loss aversion. The psychological pain of a 10% loss is roughly twice the pleasure of a 10% gain. This asymmetry, documented by Kahneman and Tversky in their 1979 Prospect Theory paper, means that falling markets feel more urgent than rising ones. The instinct is to act — to stop the bleeding. But in equity markets, acting during a fall usually means locking in the loss at the worst possible moment.
Recency bias. Investors extrapolate recent returns forward. After a strong bull run, inflows surge because recent history makes equity look like a one-way street. After a sharp correction, redemptions surge because recent history makes equity look dangerous. The market is always being evaluated through a rearview mirror — which means decisions are always one cycle behind.
Narrative capture. Market falls come with loud, credible-sounding explanations for why this time is different. In 2020 it was a global pandemic with no known endpoint. In 2022 it was inflation, rate hikes, and a land war in Europe. In 2008 it was the collapse of the global financial system. Every crash comes with a story that makes permanent impairment feel plausible. The story is usually wrong at the index level — but it is convincing enough to trigger redemptions.
The interaction of all three creates a consistent pattern across every market cycle we have data for. The average retail investor is effectively short volatility in their own portfolio — they exit when volatility spikes and re-enter after it subsides, buying back at higher prices having sold at lower ones. The result is the 5.3 percentage point annual gap that the Axis study documented.
The SIP paradox
The SIP was designed to solve exactly this problem. Systematic, automatic, fixed amount every month regardless of market level. No timing decisions. No emotional override. Just mechanical deployment into equity at whatever price the market offers that month.
And at the index level, disciplined SIPs have worked. The Nifty 500 TRI’s 15% CAGR over the last decade is available to anyone who simply stayed invested and did not intervene.
The problem is that most investors do not run flat SIPs. They pause them during crashes. They increase them during bull runs. They switch funds after a period of underperformance. Every intervention — however logical it feels in the moment — tends to degrade the outcome.
The data from our Buy-the-Dip SIP backtest makes this concrete. Even a carefully designed strategy of holding back capital to deploy during market falls underperforms a flat SIP across virtually every 5-year period tested on Nifty 500 data going back to 2005. The investor who planned to be clever underperformed the investor who did nothing. Planning to time the market was more expensive than simply ignoring it.
What to do about it
The answer is not to feel bad about having emotions. Loss aversion and recency bias are not character flaws — they are features of human cognition that evolved in environments where quick responses to threats were survival advantages. The stock market is simply a hostile environment for those instincts.
The practical answer is to make the decision once and then remove the ability to revisit it.
Decide on your asset allocation — how much in equity, how much in debt, how much in gold. Set up a SIP at that allocation. Write your investment policy in plain language: I will not pause my SIP regardless of market conditions. I will rebalance once a year. I will not check my portfolio more than once a month.
Then enforce it structurally. Turn off push notifications from your broker app. Stop reading daily market commentary. Unsubscribe from the WhatsApp groups that share Nifty levels every morning. The less frequently you look, the less frequently you will feel the urge to do something.
The market will fall again. Probably significantly, and probably when the macro story sounds most convincing. The investors who stay systematic through that fall will earn close to what the index delivers. The investors who act on the feeling will earn something considerably less — and the gap between those two outcomes compounds every year.
The 5.3 percentage point annual gap documented by Axis is not the result of bad fund picking. It is the result of good funds being managed badly by the investors inside them. The fund did its job. The investor did not.
Sources: Axis Mutual Fund 20-year investor behaviour study (2003–2022). Nifty 500 TRI 10-year CAGR data from NSE India. COVID-19 crash and recovery data: Nifty 50 peak 12,431 (January 2020), trough 7,610 (March 23, 2020), recovery November 2020. Behavioural finance references: Kahneman & Tversky, Prospect Theory (1979). Buy-the-Dip SIP backtest methodology: see Zoom Out.