
India’s IPO market has one reliable trade, and it belongs to whoever applies for the right issues, not whoever applies for the biggest ones. Across 182 mainboard listings from 2019 to 2023 (capped at 2023 so that 3 year returns of all the listings, from their date of listing, can be computed), expected return per application peaks near eight times subscribed and falls from there. The most heavily bid issues pop five times harder and pay nearly four times less per application. The question then becomes: which issues are worth capturing and can be captured reliably?
The edge is only on day one
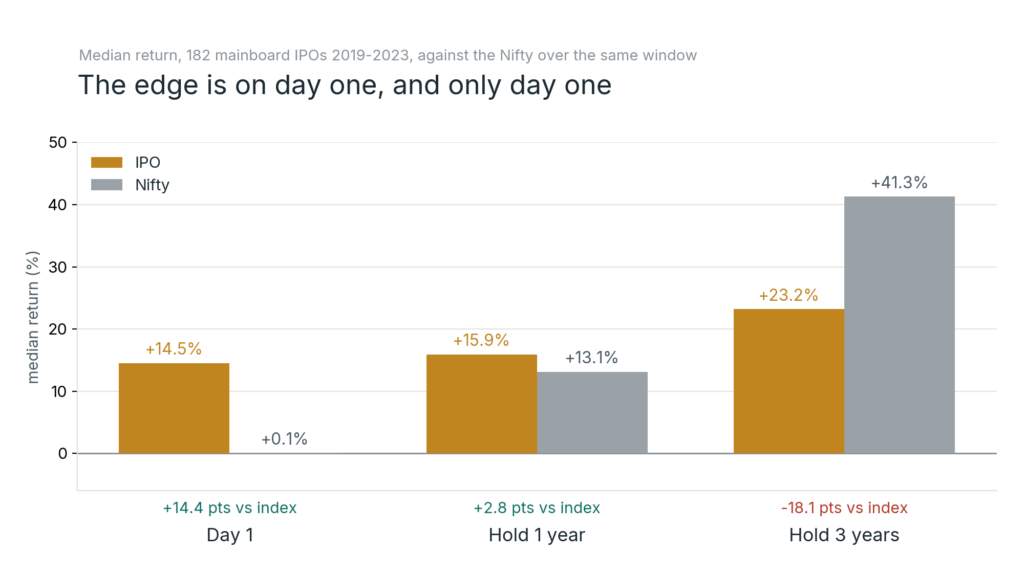
Across 182 mainboard listings from 2019 to 2023, benchmarked against the Nifty over matched windows, the pattern is unambiguous at the open and inconclusive thereafter.
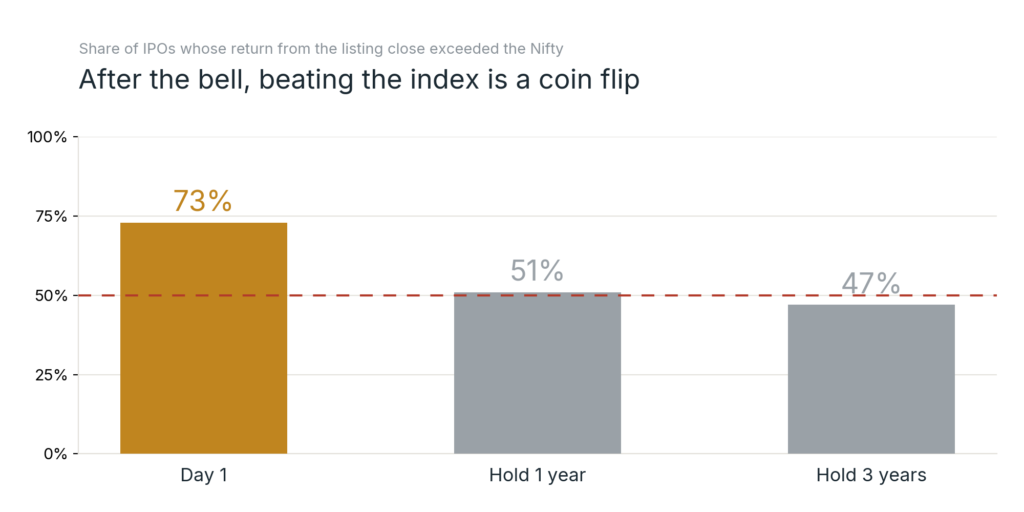
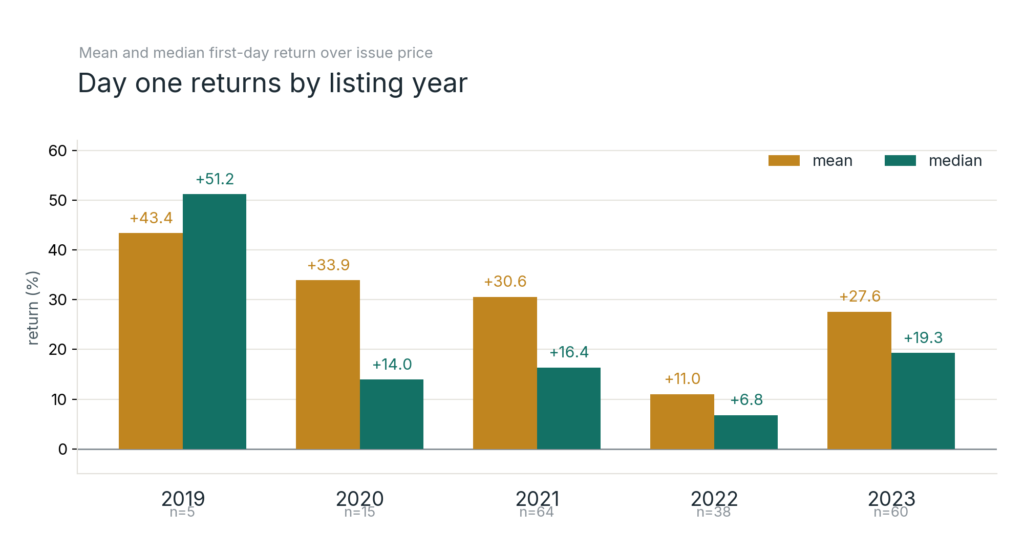
The listing pop does happen and it is large and reliable. The median debut closed 14.5 percent above its issue price on a day the index moved 0.1 percent. Three in four listings finished their first session in the green. Promoters and their venture backers have consistently left something on the table.
Past the closing bell it turns into a coin toss. Held from the listing close for a year, the median investor earns 15.9 percent against 13.1 for the index, a gap of less than half a point. Over three years the median IPO trails the Nifty by roughly 14 points. Some 51 percent beat the index over one year and 47 percent over three. That is what chance alone would produce.
The year mattered more than the company
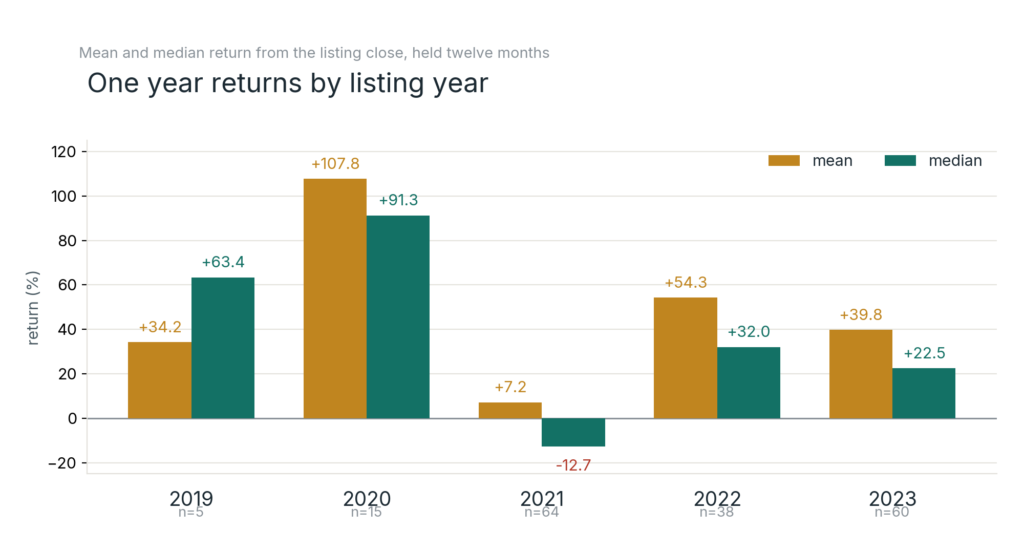
The holding-period picture is noisy partly because listing year characteristics dominate other features. The 2021 cohort, a third of the sample, returned a median of minus 12.7 percent over its first year and trailed the index by nearly 20 points while every other year led. The H1/H2 split within that cohort shows that listings in the second half of 2021 returned a median of minus 19.3 percent against plus 24.4 percent for the listings in the first half. Why the second half fared worse is conjecture. The obvious candidates are the macro turn in 2022 and a heavier concentration of loss-making platform businesses in the later wave, but this dataset cannot isolate either cause.
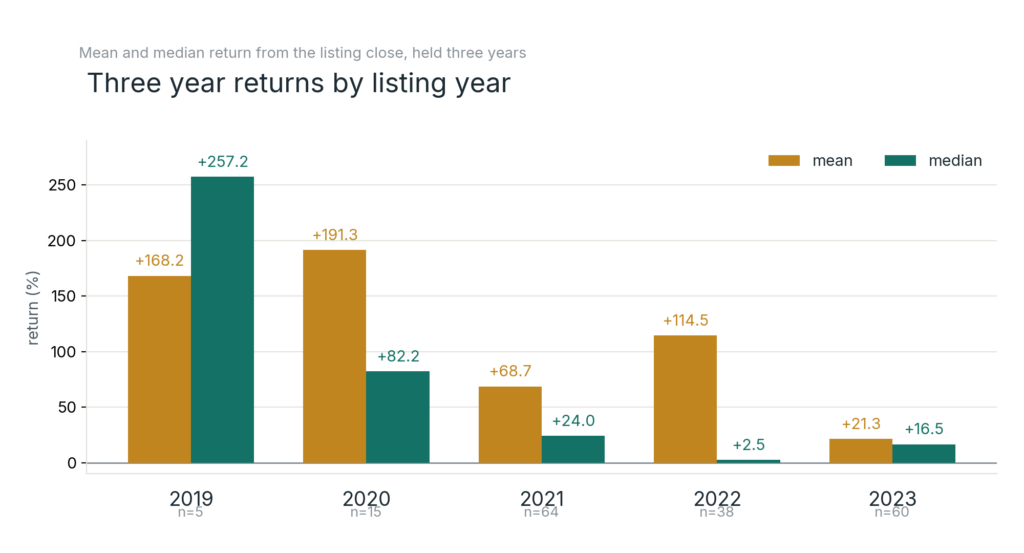
The gap between mean and median widens with every horizon. On day one the mean is 26.1 percent against a median of 14.5. By three years, it is 75.5 against 23.2. The 2022 cohort makes it stark: a three-year mean of 114.5 percent sitting above a median of 2.5. The longer the hold, the more the outcome depends on owning one of a handful of exceptional names. Most retail investors will not be concentrated enough in those names for the mean to describe their experience, which leads to median being the number that applies to them.
Pre-listing signals die at the close
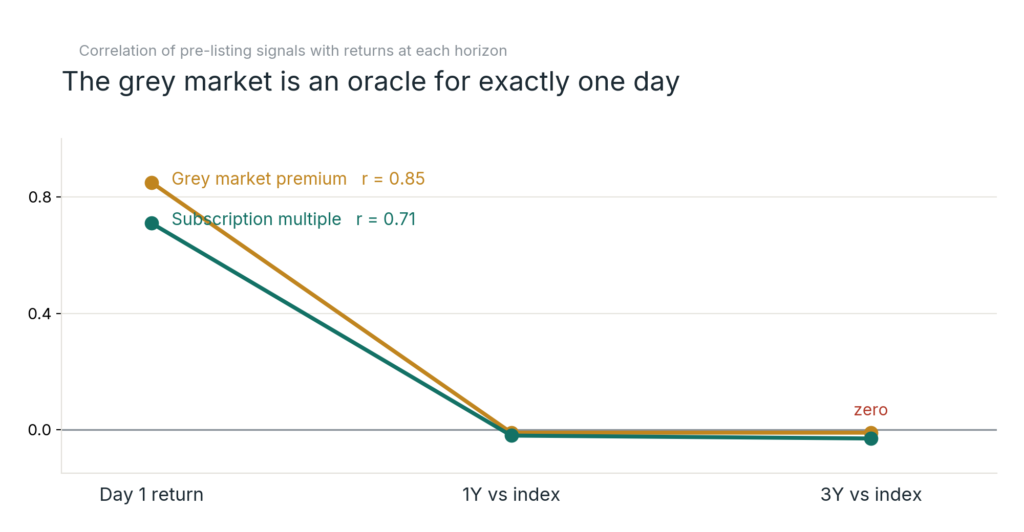
The result that should change how investors read the IPO calendar is that the grey market premium correlates at 0.85 with the day-one pop and the subscription multiple correlates at 0.71. Both numbers sound useful until you take cognisance of what happens next. Against one-year and three-year excess returns, both signals collapse to zero. The correlation between grey market premium and three-year excess return is minus 0.01.
The single most-watched pre-listing signal carries no information about what comes after the first day. Every piece of information baked into pre-listing enthusiasm is fully priced by the closing bell. Investors who treat GMP as a medium-term signal are essentially, reading a forecast that expired overnight. It carries no information about what follows.
The obvious trade is the wrong one
Ranked by subscription, mean day-one returns climb from minus 2.6 percent among barely covered issues to 74.3 percent among the most heavily bid. The natural inference to chase the largest books fails because it prices shares a retail investor cannot reliably obtain.
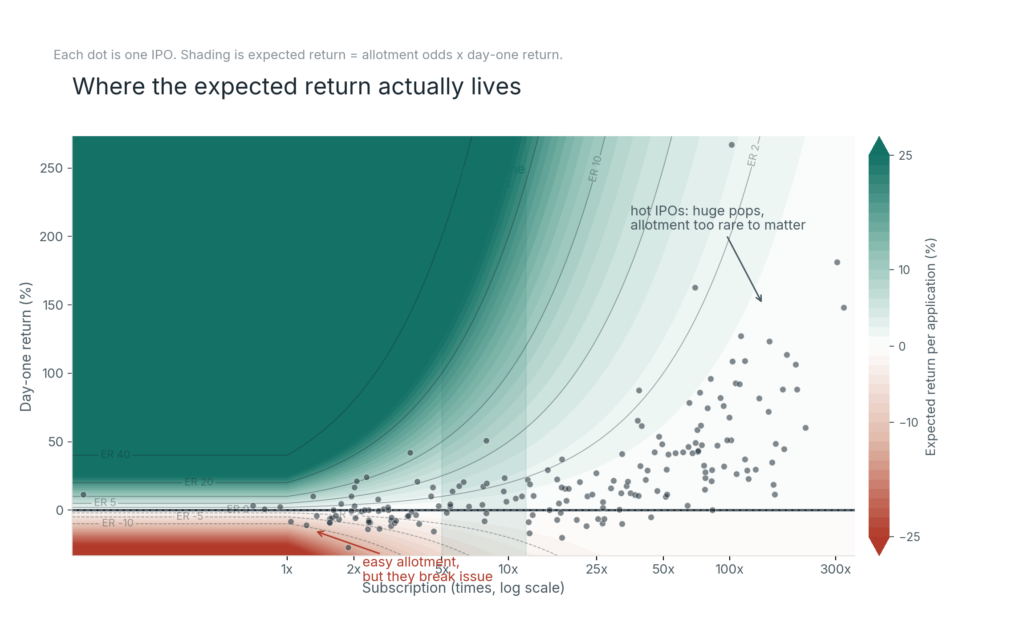
QIBs and anchor investors receive allotments at fixed quantities. Retail allotment is a lottery, and the probability of receiving shares falls as subscription rises. After weighting the day-one return by actual allotment odds, the picture inverts completely, as the expected-return surface shows. At the highest subscription levels, the expected-return per application decreases, as governed by the laws of probability. Precisely where the excitement peaks.
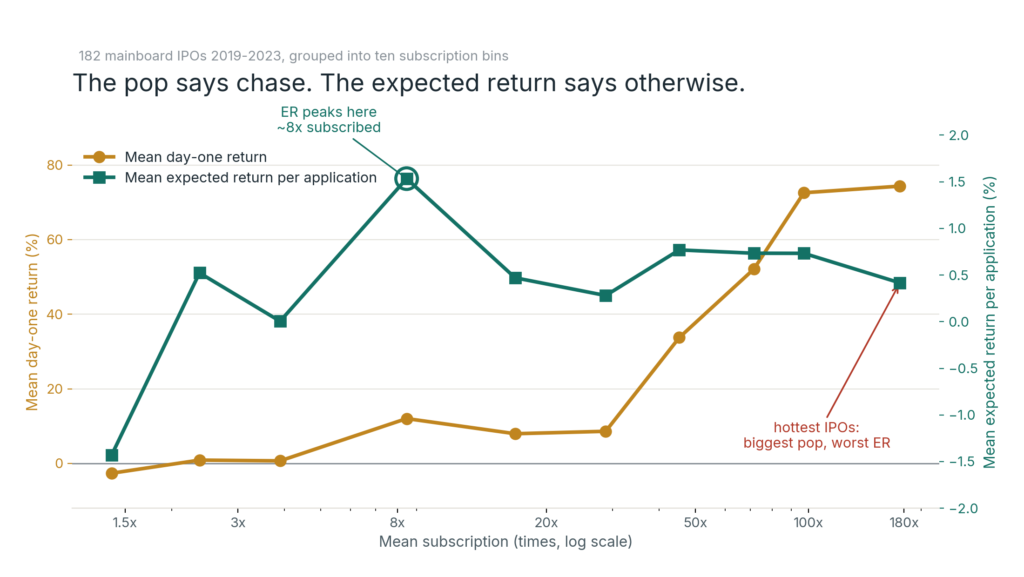
The workable band is roughly five to twelve times subscribed. In that range, one-in-eight to one-in-thirteen allotment odds still meet a double-digit median pop, and the expected return per application is at its highest. Issues below three times tend to break issue price. Issues above a hundred times almost always rise, but the probability of receiving any shares is too low to matter. The key point to take home is that the optimal subscription band and the most talked-about issues are at opposite ends of the same curve.
What the data supports
Applying in moderately subscribed issues produces a positive expected value per application. Holding from the listing close produces no measurable edge over the index and adds single-stock risk.
IPOs are not traps. The compensation is front-loaded, priced accurately by the crowd before the end of the first day. For retail investors, the question worth asking is not which IPO will pop the most. It is which issues fall in the subscription range where the probability of allotment still makes the expected return worth capturing and worth blocking your capital for.
Method
182 mainboard NSE IPOs listed 2019 to 2023. Listing pop compares the raw first-day close to the issue price. Holding returns run from the listing close on a split and bonus-adjusted basis and are differenced against the Nifty over the identical window. Three-year windows extend to the latest available date and can be shorter for recent listings. Medians are reported alongside means because the return distribution is strongly right-skewed. Significance assessed by Wilcoxon signed-rank and bootstrap confidence intervals. Subscription refers to Total Subscription and not Retail Subscription. The 2019 cohort contains only five listings and its figures should be read with caution. Expected Return = Day 1 Listing Gains x Probability of Allotment.